2D material detection for robotic control
2D materials are the future of computing. Building them, however requires huge human labor - can we automate this?
Introduction
2D materials, like the graphene, have amazing physical properties and carry the promise of bringing huge acceleration to our computer systems. Currently, building complex 2D materials (like transistors) is a laborous, boring and error-prone task, that is done by hand. In this project, I developed an autonomous Computer Vision based real-time approach that classifies and tracks the position of 2D material flakes on the substrate, under the microscope.
The basic premise is simple enough. Based on the publicly available research, one can build multilayer 2D structures (like microscopic pyramids) by following these steps (visualized in the figure below):
- Create a lot of graphene flakes (by scraping the graphite against a thin sheet of uncontaminated plastic)
- Using a microscope, locate suitable 2D flake on that flake
- Using a very fine servo-motor, slowly touch the substrate (i.e. the final destination of the flake) with the plastic
- Heat up the substrate (so that the flake also heats up - this allows it to no loger stick to the plastic)
- Peel off the plastic (if hot enough, the flake will no longer stick to it)
Visually this is seen in the following figure:
The downside to all this, is that it is the underpaid and overworked grad students scientists that do all this by hand ![]() . A useful 2D structure could take 100s of layers, and most of the times an error occurs, the process has to be started again from scratch. A huge time waste.
. A useful 2D structure could take 100s of layers, and most of the times an error occurs, the process has to be started again from scratch. A huge time waste.
This is why it is incredibly important to automate this process using robotics, and AI. Specifically, this project was fully implemented using Computer Vision (i.e. edge detection, filtration, etc.).
Set-up
The simplest way to define the ML problem is:
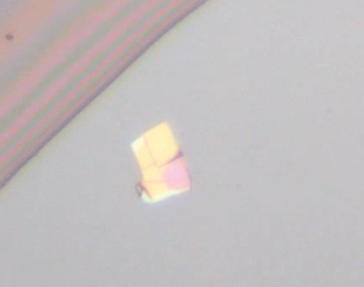
- In comes a high FPS video feed, depicting the above process, from the point of view of a microscope. For example, this:
In the above video, initially the crystal is very blurry, and comes into the focus plane of the microscope, as the PVC it being lowered to the substrate, which lies directly in the focus plane. At some point, the PVC touches the substrate, and the crystal sticks to the substrate.
- The goal of the CV application is to is to rapidly dump the following a JSON-ized information to a specified output file:
- Per-frame list of:
- unique IDs of all detected crystals
- All points of the substrate/plastic contact line
- Distances from each detected crystal to the contact line
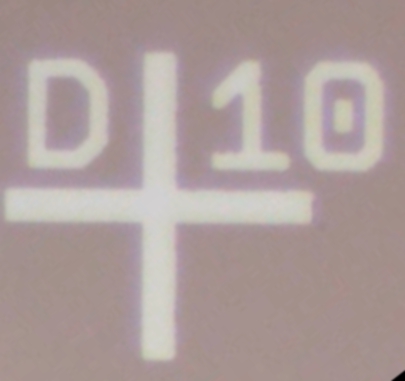
- Additionally, we have to identify the marker symbol and orientation only once per run. More about that below.
- Finally, all the processing has to be done in near-real-time performance. And, the processing has to be causal (i.e. no looking into the future frames).
- Per-frame list of:
Implementation
In essence, the implementation of this project is separated in following steps:
- Use initial 10-20 frames to identify, orient and classify the marker and its symbols.
- Use the initial frames to detect the “background” (i.e. the set of pixels on the screen that belong neither to the crystals, nor the symbols.).
- Detect crystals by performing canny edge detection, and finding closed contours (except the marker)
- Detect the polymer contact area, by subtracting the background from current frame and joining all large bright areas.
- Draw a line between contact and non-contact areas, and that is the contact line.
- Each crystal is assigned an ID based on its centroid position.
- Calculate minimum distances from each crystal to the contact line.
- Dump all the required information in the form of a simple JSON, like:
{
    "timestamp_ms": 00002131,
    "frame_num": 239,
    "crystals": [
        {
            "id": "ID09-08",
            "crystal_contour":[
                [132, 920],
                ...
            ],
            "is_covered": false,
            "polymer_distance": 322,
        }
        ...
    ],
    "polymer": {
        "polymer_contour": [
            [10, 123],
            ...
        ]
    },
    "marker": {
        "id": "D10",
        "rotation": -57,
        "oriented_bounding_box": [[560, 502], [382, 485], ...]
    }
}
- Finally, for visualization purposes, this JSON is loaded into another python script, which makes all the visualizations, and creates a video as shown above.
Challenges
To be complete…
Conclusion
To be complete…